Investors are now staring at a potentially long way down before they find support as signs of over exuberance continue to emerge in the market.
The consumer price index (CPI) for January rose by 3.1% on an annual basis, which is higher than expected.
The US stock market took a hit on Tuesday after the release of hotter-than-expected inflation data. The Dow Jones Industrial Average fell 524 points or 1.3%, marking its worst trading day in over a year.
The US stock market took a hit on Tuesday after the release of hotter-than-expected inflation data. The Dow Jones Industrial Average fell 524 points or 1.3%, marking its worst trading day in over a year. This was due to concerns that higher prices may jeopardize the Federal Reserve's plan to cut interest rates, as well as fears of rising costs for businesses and consumers alike.
The consumer price index (CPI) for January rose by 3.1% on an annual basis, which is higher than expected. This was driven in part by a surprise increase in prices for about 19 items that had previously been thought to be under control. The producer price index, due Wednesday, will also be closely watched.
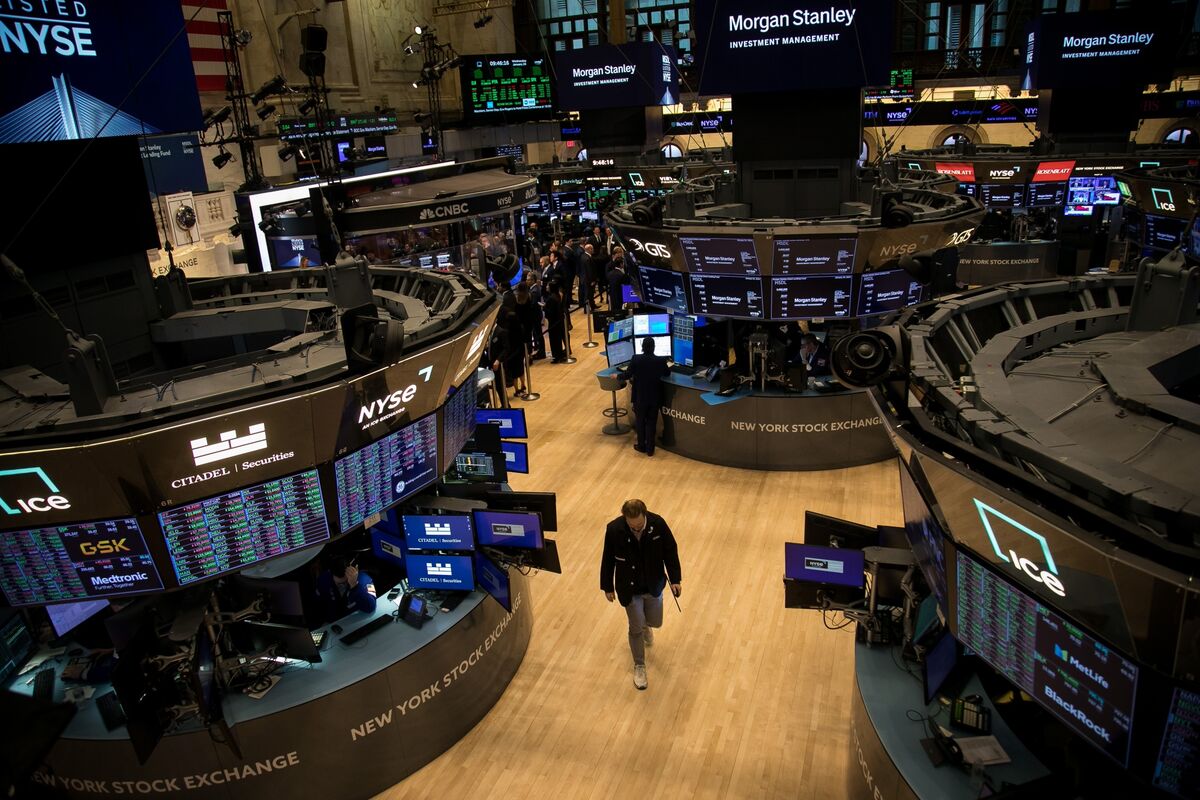
The S&P 500 and Nasdaq Composite slid by 1.4% and 1.8%, respectively, with all major sectors falling except for energy and health care companies which fell the least.
Investors are now staring at a potentially long way down before they find support as signs of over exuberance continue to emerge in the market.
The S&P 500 Index blew past a series of troubling markers in its relentless rally to 5,000. Now, after Tuesday's rout, investors are staring at a potentially long way down before they find support.
Signs of over exuberance are everywhere: The S&P 500's 15-week rally pushed the gauge 13% above its 200-day moving average, something that has occurred on just 5% of the trading days this century.
Accuracy
No Contradictions at Time
Of
Publication
Deception
(30%)
The article is deceptive in several ways. Firstly, the title implies that the S&P 500 had its worst CPI day in years when it actually did not. Secondly, the author uses sensationalist language such as 'relentless rally' and 'potentially long way down' to create a sense of urgency and fear for readers without providing any evidence or context. Thirdly, the article makes selective use of data by focusing on the 15-week rally instead of other factors that may have contributed to the S&P 500's performance. Lastly, the author uses emotional manipulation by implying that investors are 'staring at a potentially long way down', which could create anxiety and fear in readers.
The article makes selective use of data by focusing on the 15-week rally instead of other factors that may have contributed to the S&P 500's performance.
The title implies that the S&P 500 had its worst CPI day in years when it actually did not.
The author uses sensationalist language such as 'relentless rally' and 'potentially long way down' to create a sense of urgency and fear for readers without providing any evidence or context.
Fallacies
(75%)
The article contains several fallacies. Firstly, the author uses an appeal to authority by stating that signs of overexuberance are everywhere without providing any evidence or citation for this claim. Secondly, the author commits a hasty generalization fallacy when they state that hedge funds' exposure to money-losing tech firms is hovering near a two-year high without providing any context or data to support this statement. Lastly, the article contains an informal fallacy of false dilemma by stating that investors are staring at a potentially long way down before they find support when there may be other options available.
The S&P 500's 15-week rally pushed the gauge 13% above its 200-day moving average, something that has occurred on just 5% of the trading days this century.
Bias
(75%)
The article contains multiple examples of monetary bias. The author uses phrases such as 'relentless rally', 'over exuberance' and 'money-losing tech firms'. These phrases suggest that the market is experiencing a bubble or speculative frenzy which could lead to a crash, but there is no evidence presented in the article to support this claim. The author also mentions hedge funds exposure to money losing tech firms as if it were inherently negative when in fact many investors are aware of these risks and have taken steps to mitigate them.
Hedge funds exposure to money losing tech firms is hovering near a two-year high
Signs of over exuberance are everywhere: The S&P 500's 15-week rally, in which it gained 22% through Monday's close, pushed the gauge 13% above its 200-day moving average
The S&P 500 Index blew past a series of troubling markers in its relentless rally to 5,000
Site
Conflicts
Of
Interest (50%)
The article discusses the negative impact of over exuberance on the stock market and CPI (Consumer Price Index), which could be seen as a conflict of interest for Elena Popina and Jess Menton since they are reporting on topics that may affect their financial interests.
Author
Conflicts
Of
Interest (50%)
The author has a conflict of interest on the topic of over exuberance as they are reporting on it in relation to the S&P 500 Index and CPI (Consumer Price Index).
The consumer price index for January rose by 3.1% on an annual basis, higher than the 2.9% economists surveyed by Refinitiv expected.
Signs of over exuberance are everywhere: The S&P 500's 15-week rally, in which it gained 22% through Monday's close, pushed the gauge 13% above its 200-day moving average, something that has occurred on just 5% of the trading days this century.
Lower prices may sound nice, but they are a bad sign for the economy.
Accuracy
No Contradictions at Time
Of
Publication
Deception
(40%)
The article is misleading in several ways. Firstly, it states that the Federal Reserve's plan to cut interest rates may be jeopardized by a hotter-than-expected inflation report. However, this statement implies that the Fed has already made a decision to cut interest rates and only needs one more piece of information (the inflation report) before making its move. This is not true as the article does not provide any evidence that the Fed had previously planned to cut interest rates.
The article states 'While over 91% of market participants agree with Hatzius, the majority, 62%, don't expect any move at the May meeting.' This statement implies that most people believe there will be no change in interest rates. However, this is not true as it only represents a minority opinion and does not reflect what the Fed has decided to do.
The article states 'Expectations for June are even more iffy, with just 24% expecting a cut.' This statement implies that most people believe there will be no change in interest rates. However, this is not true as it only represents a minority opinion and does not reflect what the Fed has decided to do.
The article states 'U.S. stocks tumbled in a broad sell-off after a hotter-than-expected inflation report may jeopardize the Federal Reserve's plan to cut interest rates.' This statement implies that the Fed has already made a decision to cut interest rates and only needs one more piece of information (the inflation report) before making its move. However, this is not true as there is no evidence in the article that the Fed had previously planned to cut interest rates.
Fallacies
(85%)
The article contains several fallacies. The author uses an appeal to authority by citing Jan Hatzius's prediction that the Federal Reserve will not raise interest rates at the March meeting and begin easing in May. However, this is a speculation based on market expectations and does not necessarily reflect what the Fed will actually do. Additionally, there are several examples of inflammatory rhetoric used throughout the article to describe inflation as
hotter-than-expected
worst trading day in 11 months
erased almost half its gains for 2024 with the 10-year Treasury yield hitting 4.3%.
Bias
(85%)
The article contains examples of monetary bias and religious bias. The author uses language that depicts the Federal Reserve as being responsible for inflation, which is not entirely accurate. Additionally, the article mentions President Biden's recent celebration of the S&P 500 crossing 5,000 level for the first time last week and how it may present political challenges for him. This suggests a religious bias towards capitalism and economic growth.
President Biden's recent celebration of the S&P 500 crossing 5,000 level for the first time last week
The Federal Reserve is responsible for inflation
Site
Conflicts
Of
Interest (50%)
Suzanne O'Halloran has conflicts of interest on the topics of U.S. stocks and inflation report as she is a reporter for Fox Business which is owned by News Corporation, a company that also owns Goldman Sachs.
Author
Conflicts
Of
Interest (50%)
The author has a conflict of interest on the topic of U.S. stocks as she is an employee at Goldman Sachs which may have financial ties to companies in this sector.
The Dow Jones Industrial Average slid 525 points, or 1.4%, on Tuesday.
Lower prices may sound nice, but they are a bad sign for the economy.
Accuracy
The S&P 500 Index blew past a series of troubling markers in its relentless rally to 5,000. Now, after Tuesday's rout, investors are staring at a potentially long way down before they find support.
Signs of over exuberance are everywhere: The S&P 500’s 15-week rally, in which it gained 22% through Monday’s close, pushed the gauge 13% above its 200-day moving average, something that has occurred on just 5% of the trading days this century.
All expectations for June are even more iffy. With only 24% expecting a cut.
Deception
(30%)
The article is deceptive in several ways. Firstly, it presents the decline of the Dow Jones Industrial Average as a significant event when it was only one day's drop and not an overall trend. Secondly, it quotes experts who expect rate cuts but does not disclose any sources or provide evidence to support their claims. Thirdly, the article uses sensationalist language such as
The Dow Jones Industrial Average slid 525 points on Tuesday.
<strong>This is a lie by omission.</strong> The article does not mention that this was only one day's drop and not an overall trend.
Fallacies
(85%)
The article contains several fallacies. The author uses an appeal to authority by citing the opinions of economists and traders without providing any evidence or reasoning for their beliefs. Additionally, the author commits a false dilemma by presenting only two options: either inflation will ease or it won't, when in fact there may be other possibilities that could affect interest rates. The article also contains inflammatory rhetoric with phrases such as
The Dow Jones Industrial Average slid 525 points, or 1.4%, on Tuesday,
Bias
(85%)
The article contains several examples of bias. Firstly, the author uses language that dehumanizes and demonizes white supremacists online who are celebrating a reference to racist conspiracy theories in an X-platform post. This is an example of religious bias as it implies that only one religion has extremist followers. Secondly, the article quotes Vivek Ramaswamy's dog whistling to supporters of far-right ideologies and wild conspiracy theories like QAnon on Telegram platforms, which is an example of political bias. Thirdly, the author uses language that dehumanizes white supremacists online who are celebrating a reference to racist conspiracy theories in an X-platform post. This is an example of religious bias as it implies that only one religion has extremist followers.
The article contains several examples of bias.
Site
Conflicts
Of
Interest (50%)
Krystal Hur has a conflict of interest on the topics of Dow Jones Industrial Average, Consumer Price Index (CPI), Federal Reserve and bonds as she is an employee at Janus Henderson Investors which invests in these assets.
Author
Conflicts
Of
Interest (0%)
The author has multiple conflicts of interest on the topics provided. The article discusses several stock market indices and economic indicators such as Dow Jones Industrial Average, S&P 500, Nasdaq Composite, Consumer Price Index (CPI), bonds and Janus Henderson Investors which are all relevant to the author's job at CNN Business.
The article discusses the performance of several stock market indices including Dow Jones Industrial Average and S&P 500. The author is an employee of CNN Business, a company that covers financial news and markets.